Contribution to the Integration of Topology Optimisation in the CAD process
Video samples
Description
In the design of mechanical parts or structures, one of the major and most important requirements is strength and finite element analysis (FEA) has proven its great potential when trying to optimize parts and structures. The optimization process usually consists of trying to minimize weight while insuring to sustain the loads applied. FEA has been used for many years for this type of purposes and with time, several methods have been introduced to automate the optimizations process. These methods are based on applying the FEA method to shapes that are evolving through an automatic process. Among these methods, we focus in the work presented here, on topology optimization methods, which have been a field of very promising and active research for the last fifteen years. The great potential of these approaches is that the shape evolution mentioned above is not constrained by the initial topology and this leads to results where the final topology is not known a priori.
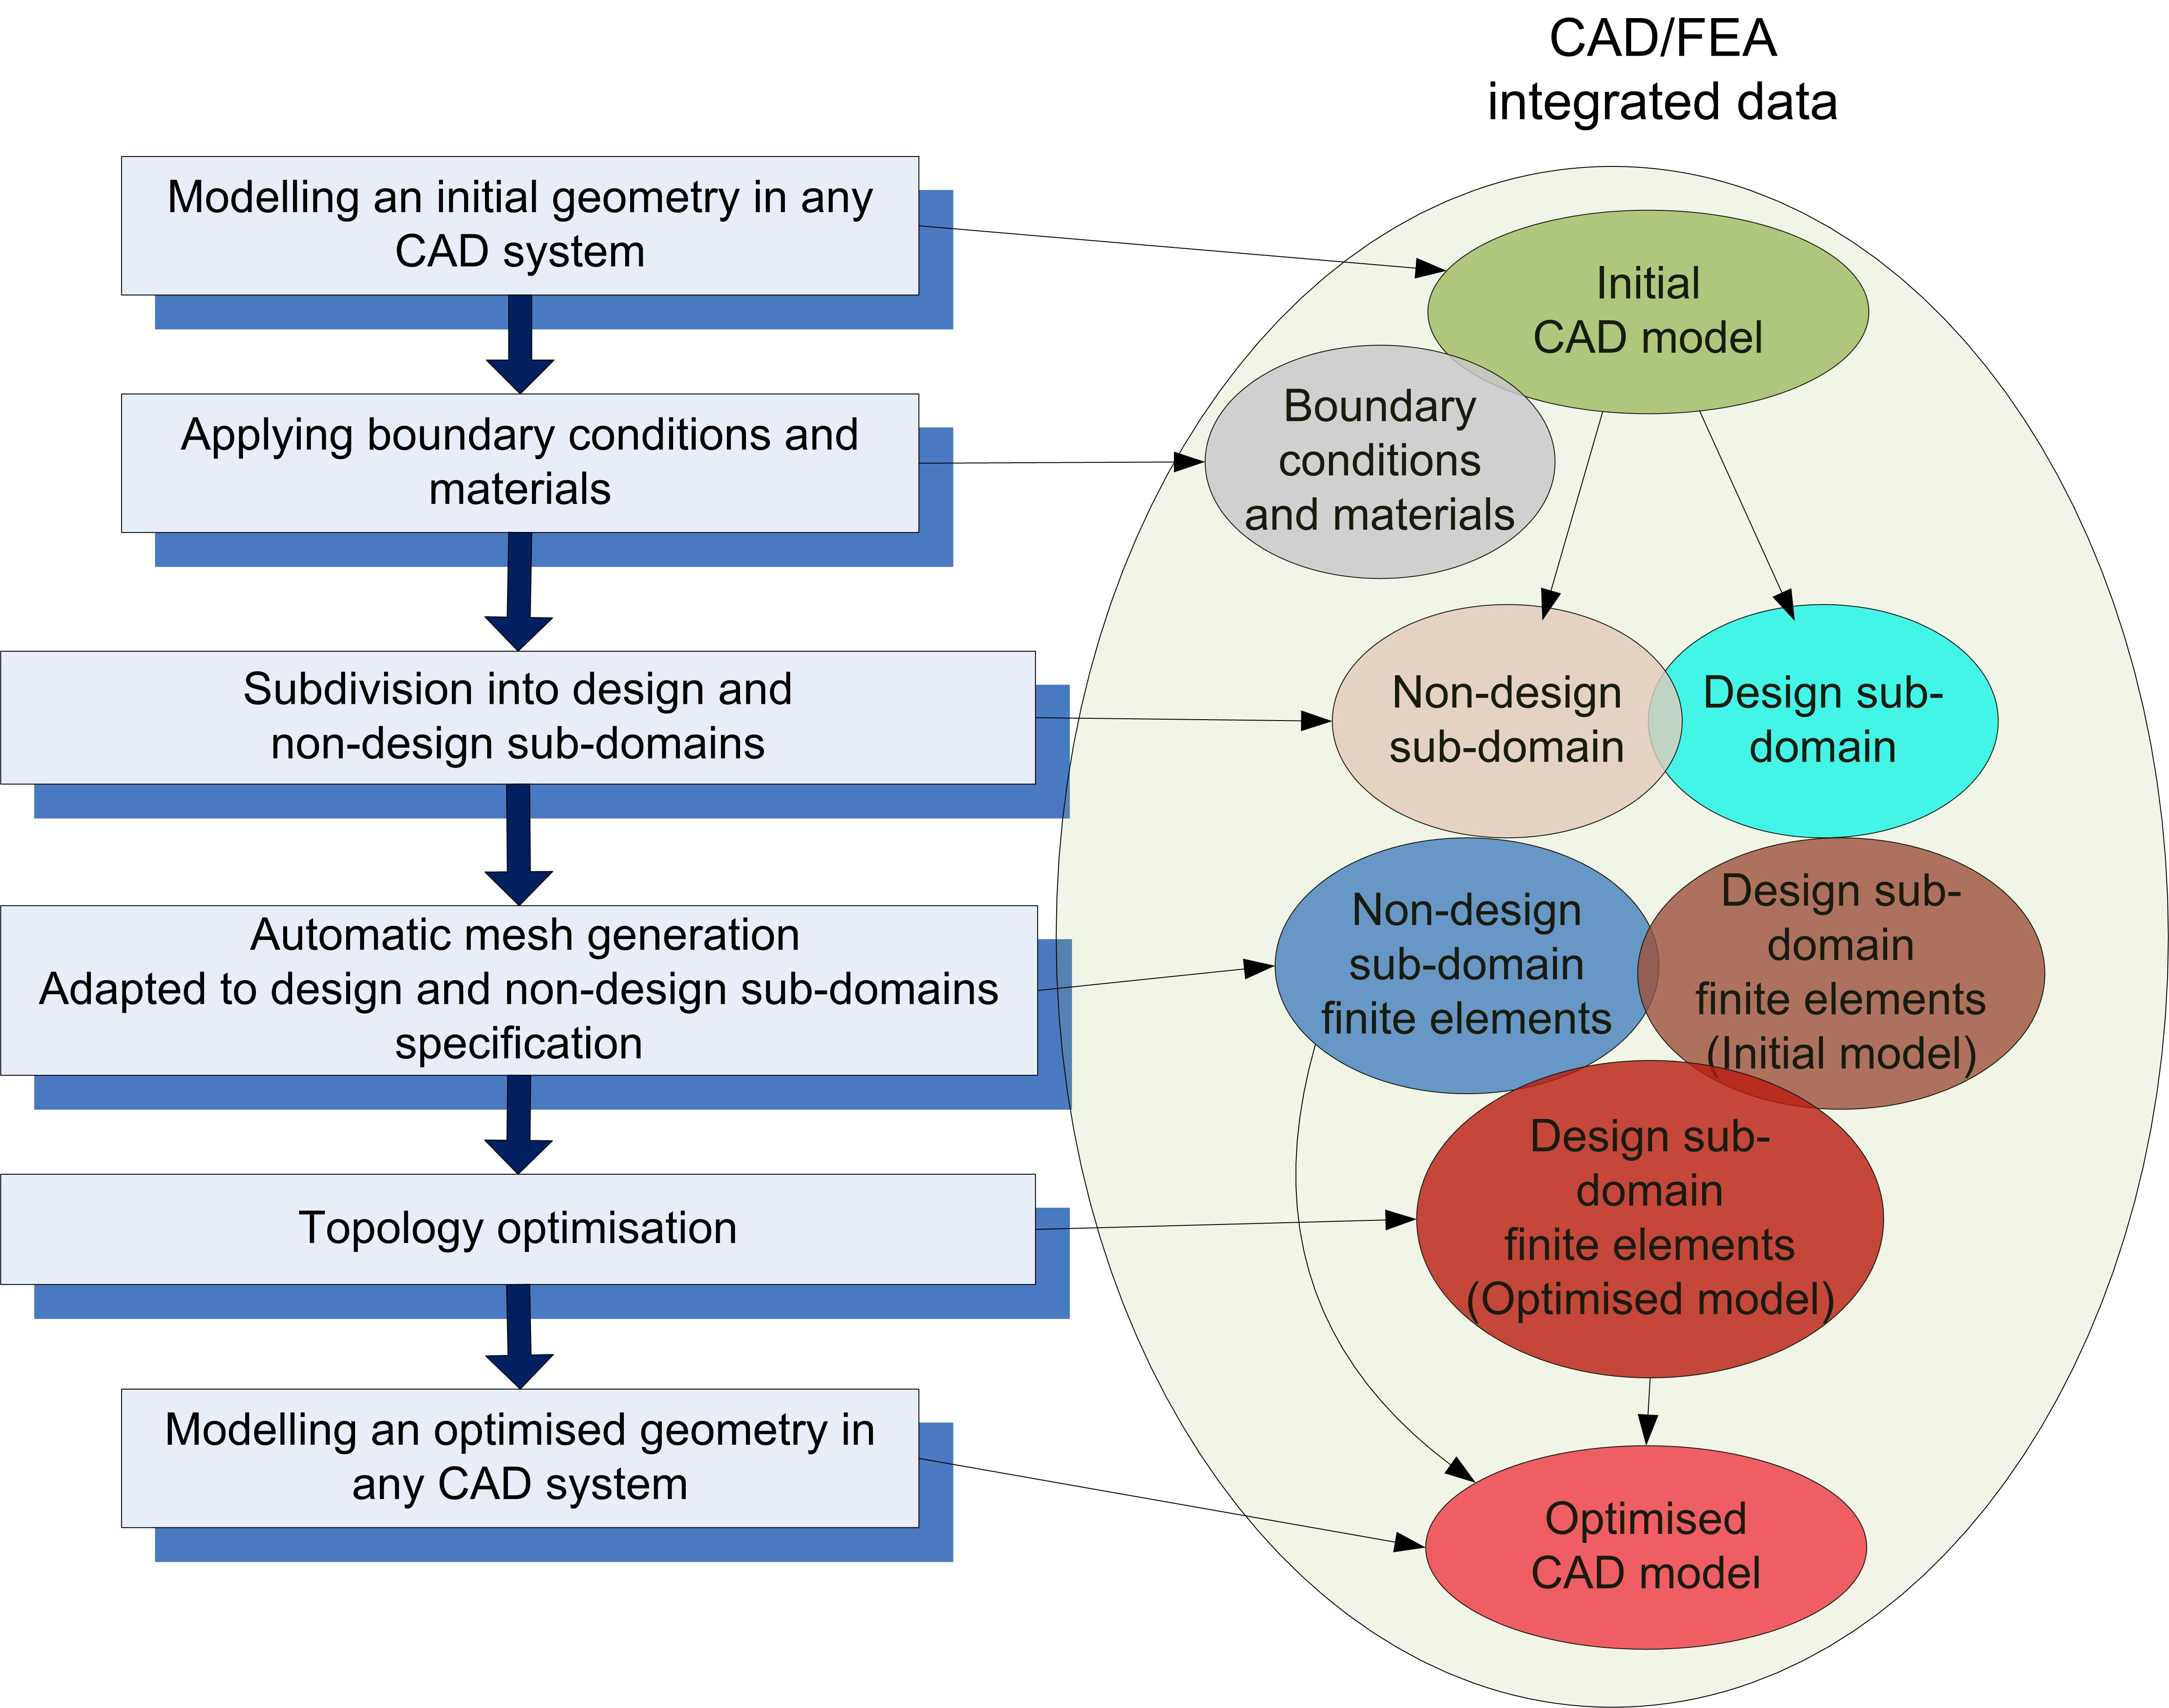
Moreover, the evolution of geometric modeling, automatic mesh generation and topology optimization methods now allows foreseeing the integration of topology optimization into the product design process and by the way, sets up the conditions for its wider use. Figure 1 presents a general framework for the integration of topology optimization technology into the CAD world and the overall process can be synthesized by considering several basic steps.
Figure 1: A scheme of Topology optimization integration
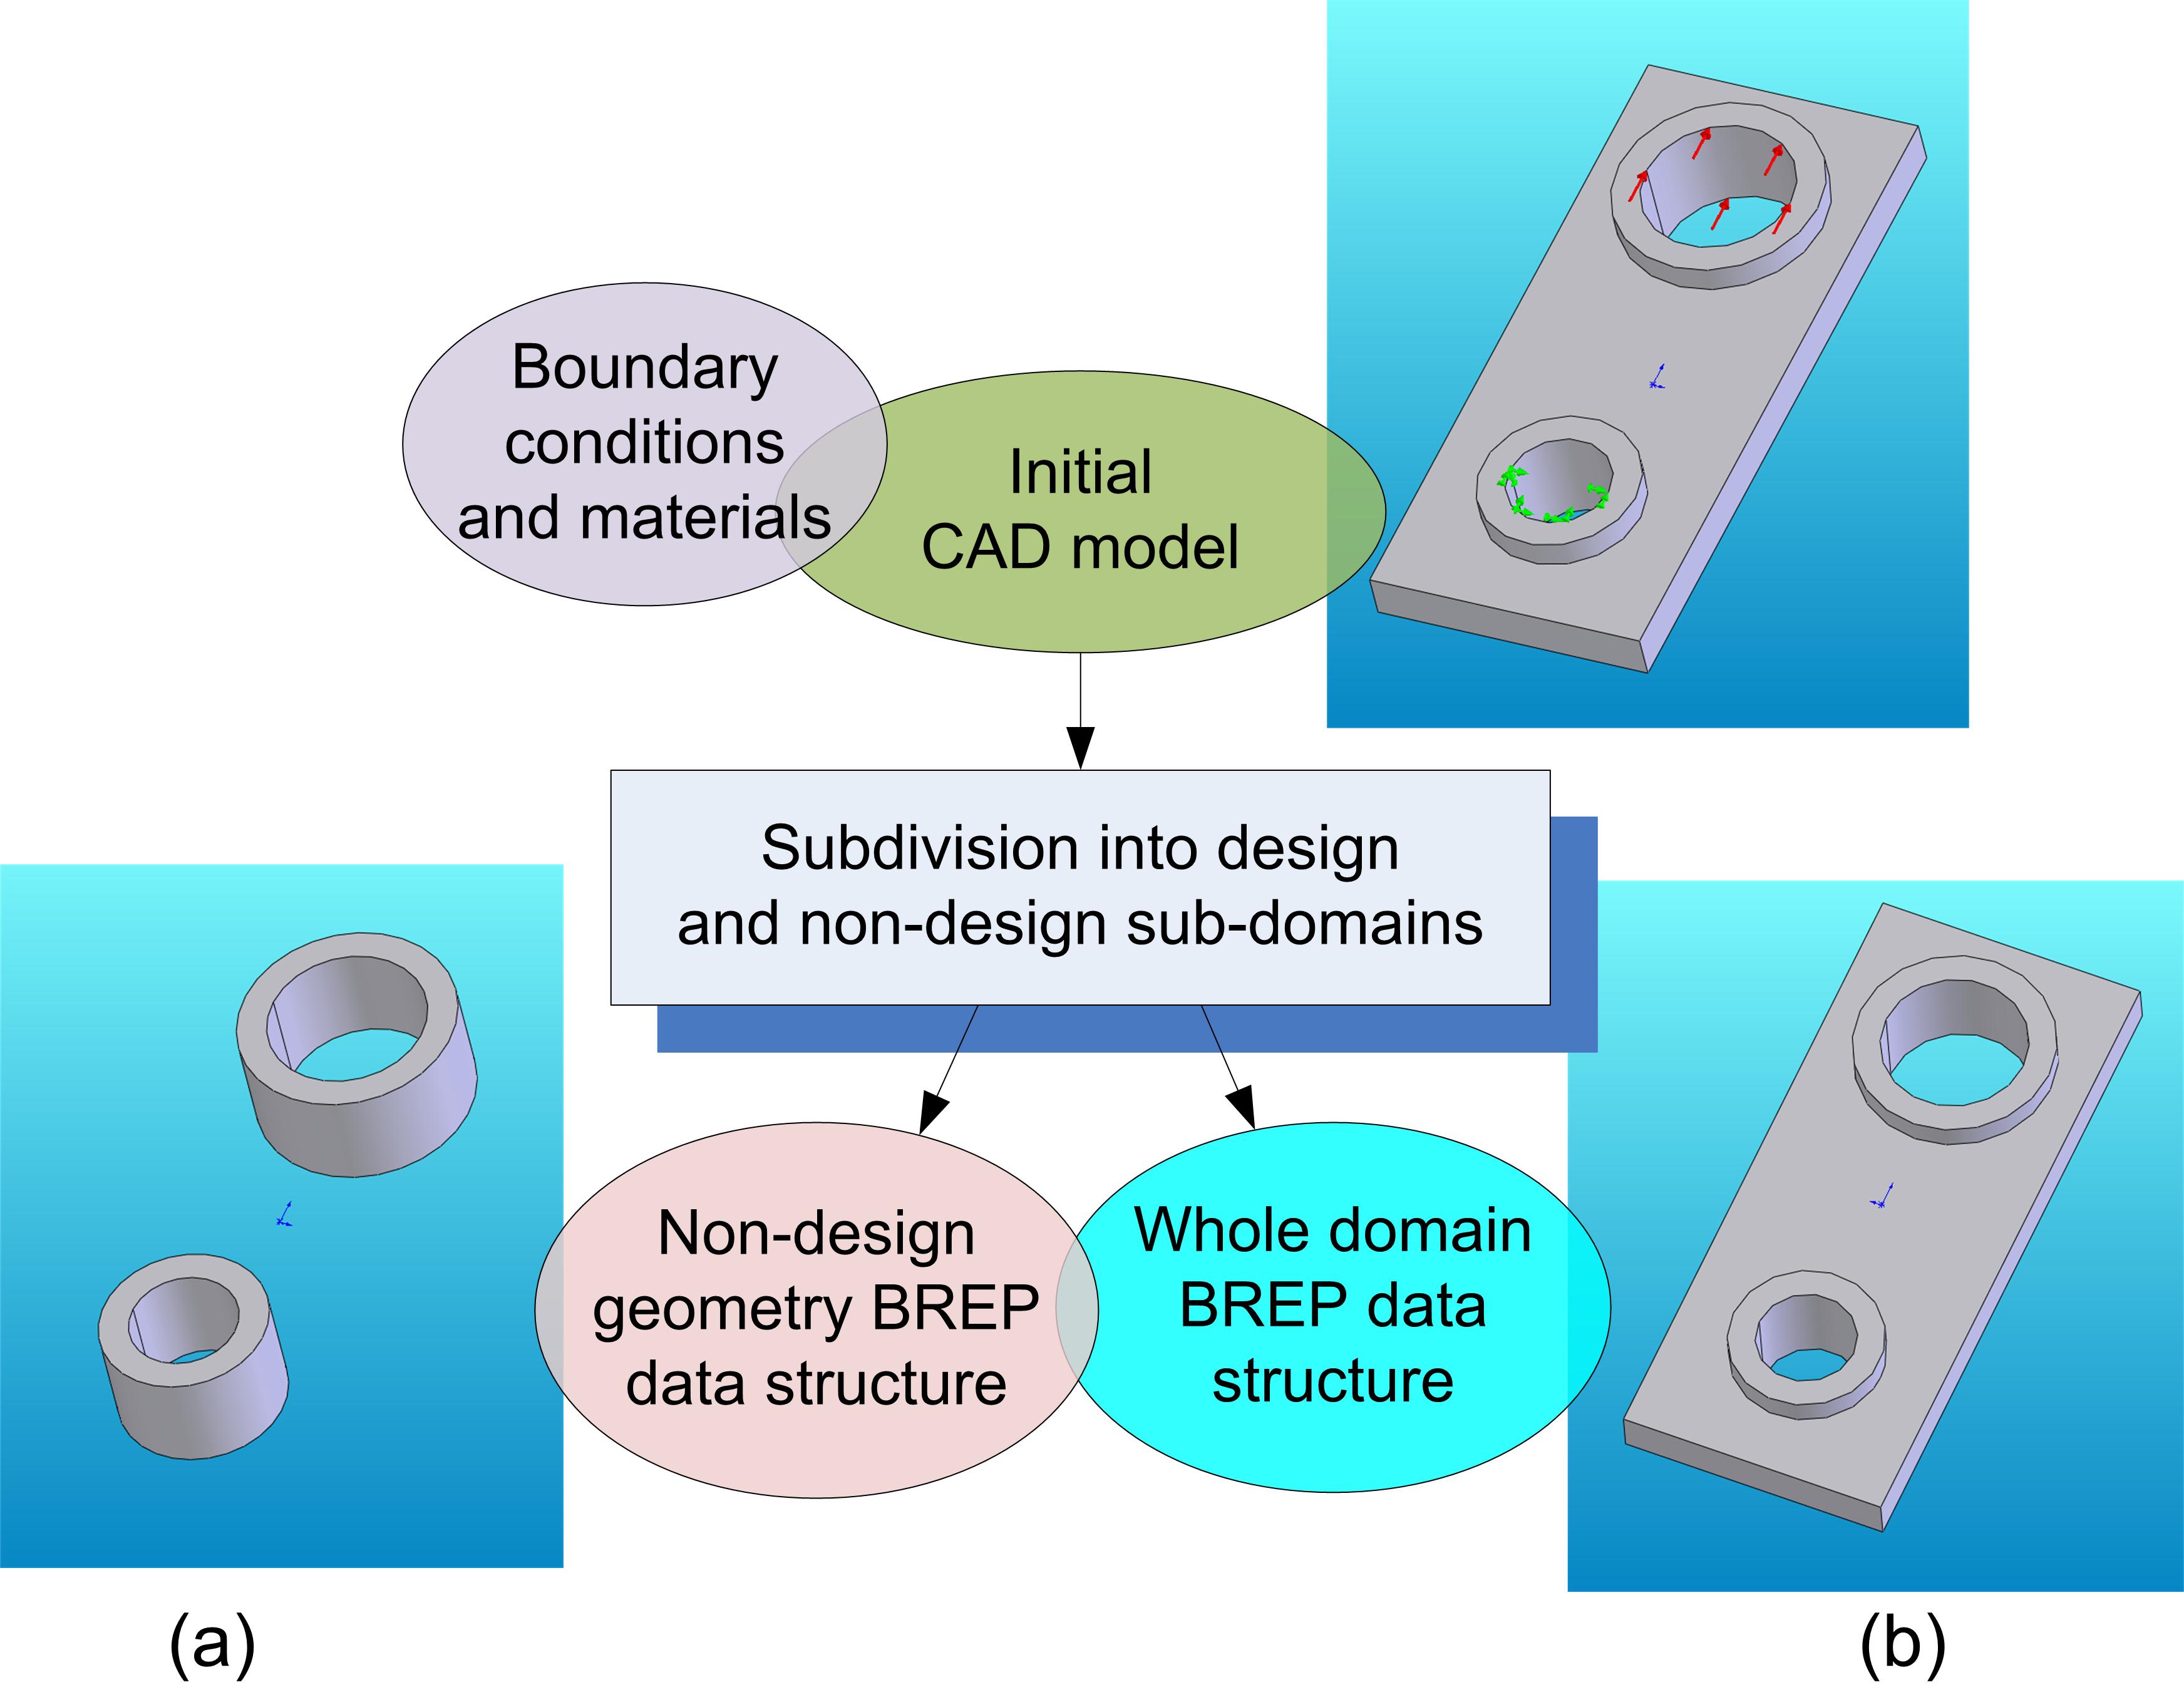
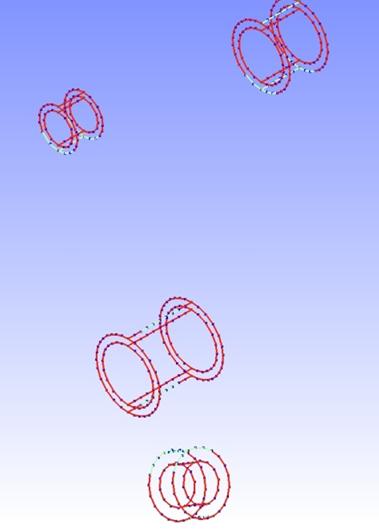
At this point, the definition of design and non-design subdomains is done as illustrated in Figure 2. Design and non-design sub-domains are defined through two separate B-Rep models, one associated with the entire model and the other one with non-design geometry. By the way, the design sub-domain is defined indirectly.
Figure 2: The definition of design and non-design sub-domains
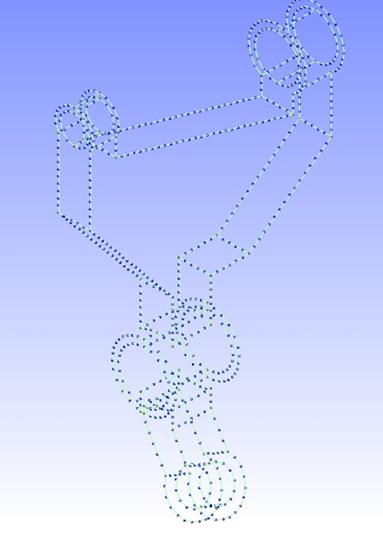
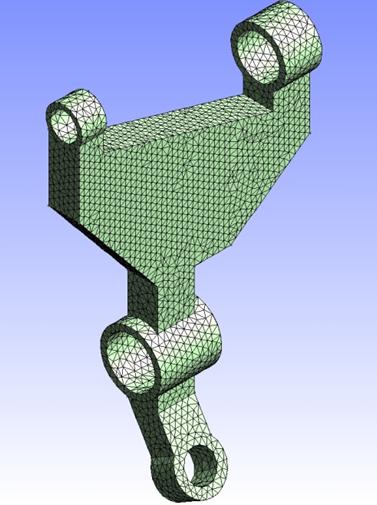
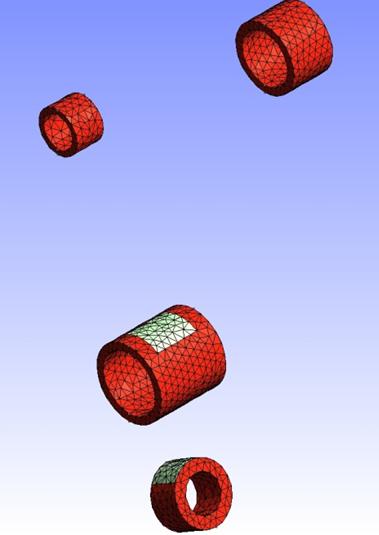
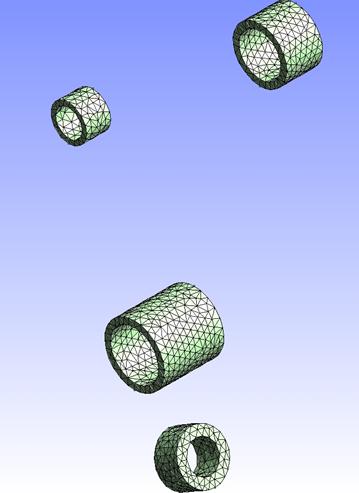
This specific definition of geometry implies the adaptation of algorithms presented in the previous section so that, at the end, we obtain a conformal mesh of the entire model with finite elements tagged as design elements and non design elements. This is performed through a mesh generation process featuring 14 steps. Some of these steps are illustrated in Figure 4 on a sample case introduced in Figure 3.
Figure 3: The sample CAD model and non-design sub-domains associated
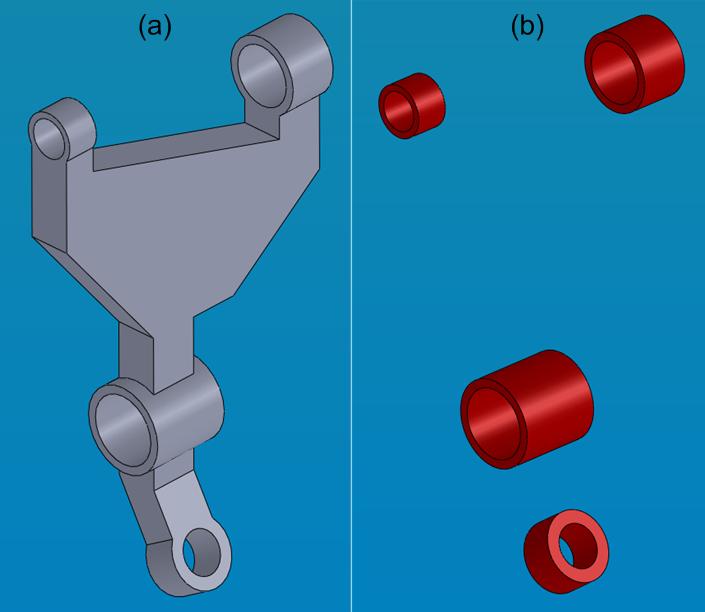
Figure 4: An automatic mesh generation process in 14 steps
In this work, topology optimization is based on the solid isotropic material with penalization (SIMP) method, which is a very standard optimization method. The basic principle on which the SIMP method is based is to consider a sort of “porous” material and to compute the evolution of its relative density distribution over the design sub-domain. The objective of the SIMP method is minimizing (through iterative FEA calculations) the structure's global compliance in order to obtain the best weight-stiffness ratio. Solving the ptimization problem consists of minimizing the global compliance with a constraint on the amount of retrieved material over the whole iterative process. It is important to mention that the choice of the SIMP method is quite arbitrary and that any other topology optimization method could (and can) be considered instead.
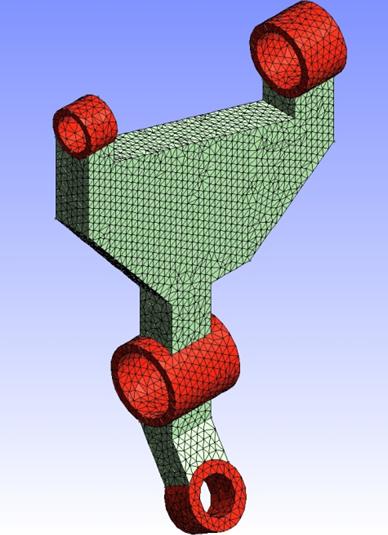
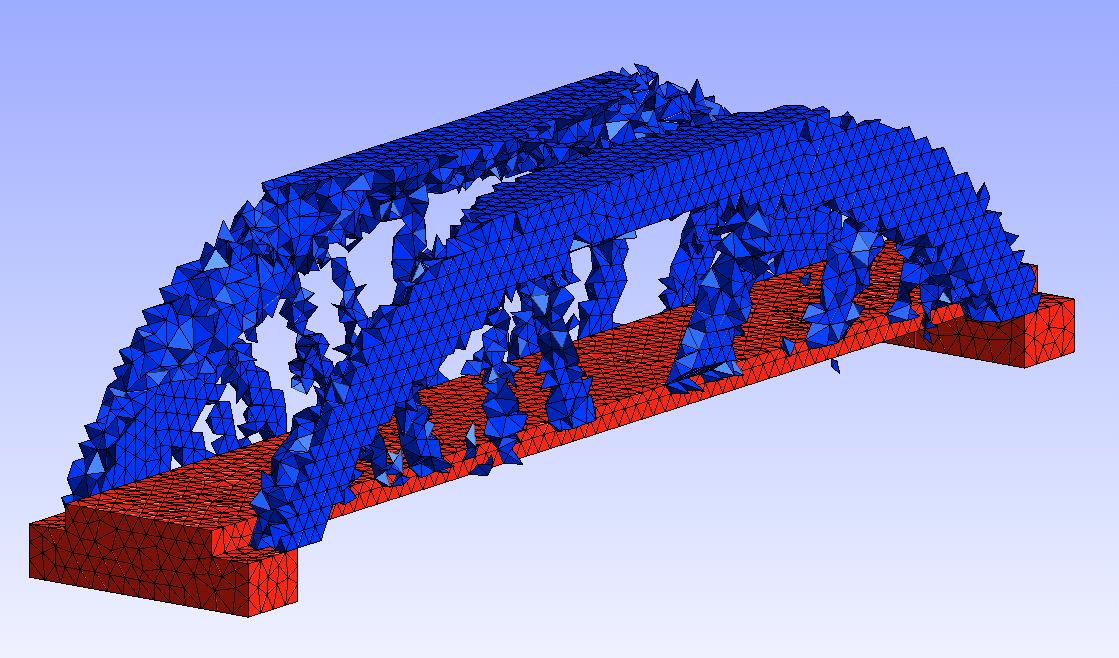
Figure 6 illustrate raw results (a material relative density distribution) obtained with the simp method on a sample case introduced in Figure 5. Figure 7 illustrate the shape derived from these raw reasults when considering a threshold on the relative density distribution.
Figure 5: A first optimization example (non design elements are in red)
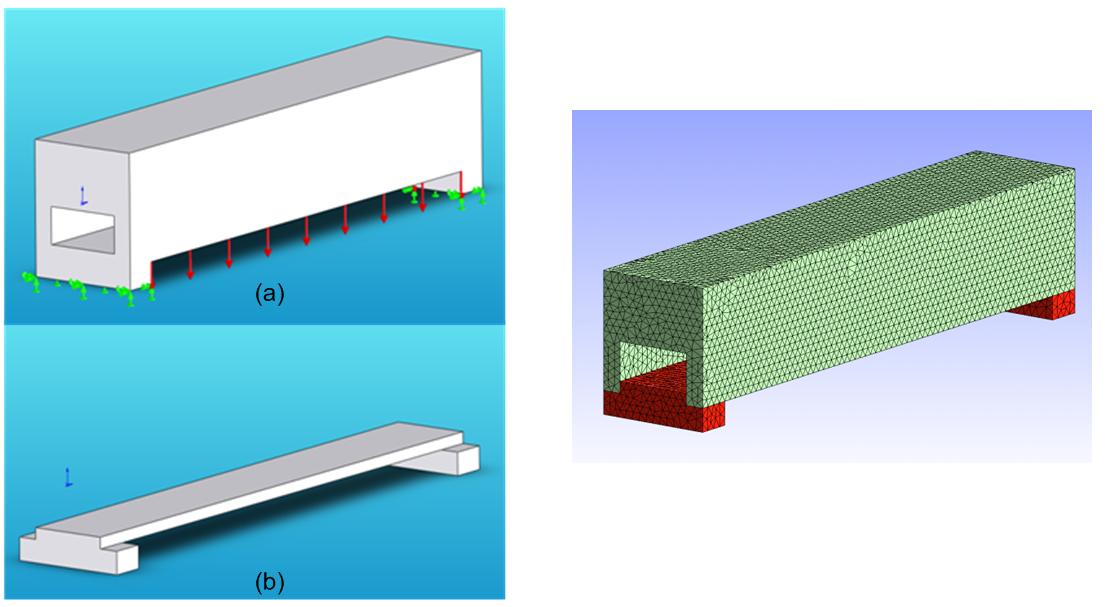
Figure 6: Raw SIMP results obtained on the first optimization example
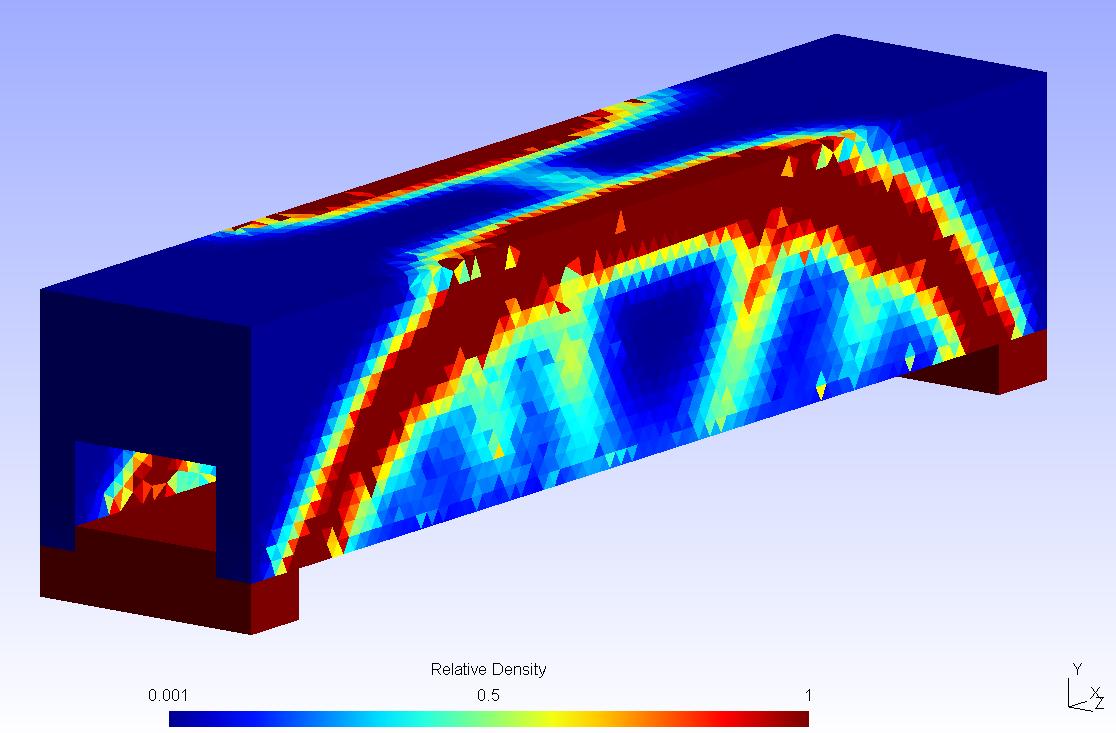
Figure 7: The optimized shape derived for the first optimization example
Figures 8, 9 and 10 illustrate results obtained on a second sample part.
Figure 8: A second optimization example (non design elements are in red)
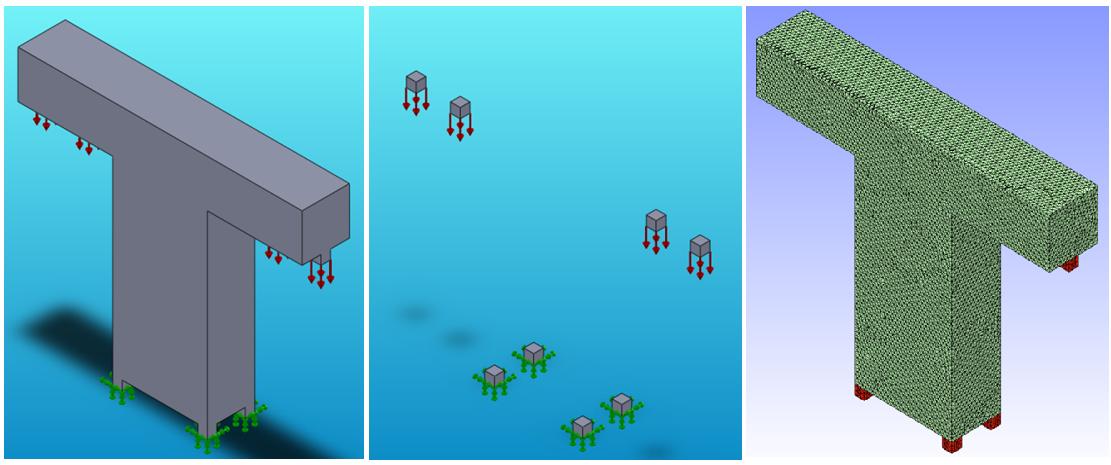
Figure 9: Raw SIMP results obtained on the second optimization example
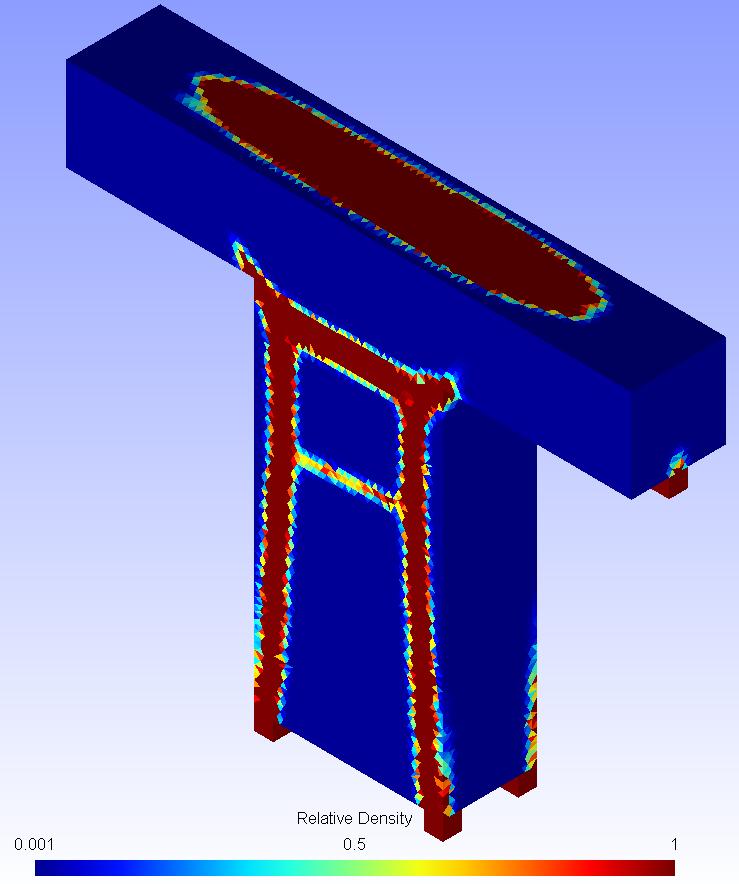
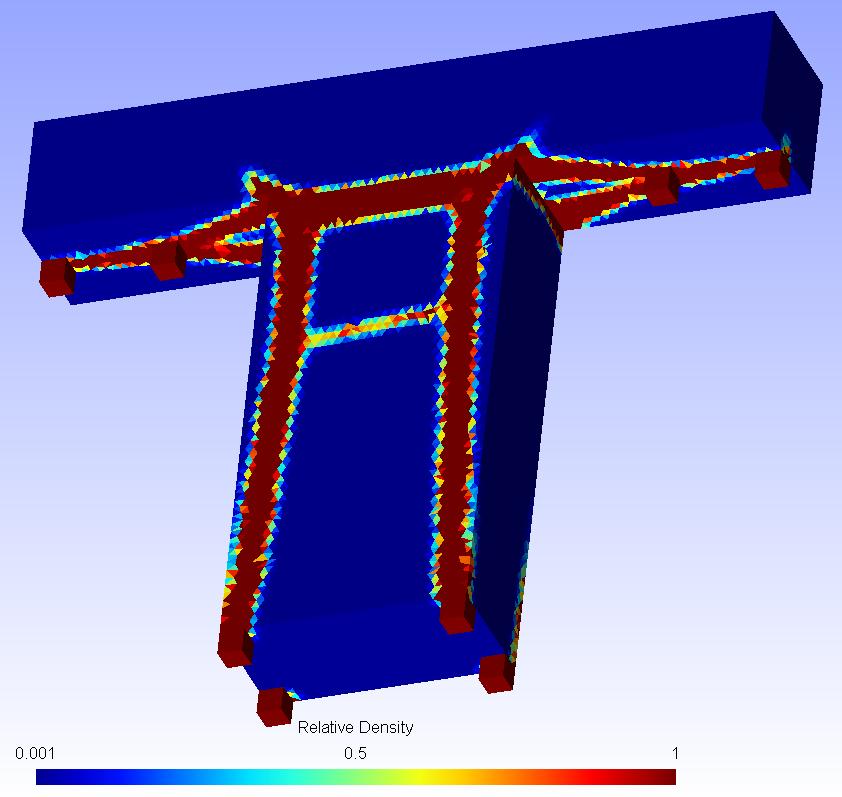
Figure 10: The optimized shape derived for the second optimization example
